General
We continue to explain everything to you to optimize your DeFi trading.
- Let’s talk about technical analysis and how to make use of it in DEXTools! You can access our DEXTboard here.
- In this previous article we talked about the 10 key factors that can make your trading more secure and profitable.
- In this other article, we explained 8 essential security tips to protect your crypto assets.
- And here we explained 7 advanced strategies for DeFi trading.
The Importance of Technical Analysis in Crypto Trading
- Crypto trading has become an exciting and lucrative activity, attracting both novices and experts. However, to succeed in this field, mastering technical analysis is crucial.
- With DEXTools, traders can analyze data, identify patterns, and make informed decisions.
- Now, we will see why Technical Analysis is so important, and how you can use it in DEXTools to improve your trading strategies.
Let’s go for it!
What is Technical Analysis?
- Technical analysis in crypto involves studying past price charts and trading volumes, to predict future market behaviors.
- Traders utilize various indicators and tools, such as moving averages, relative strength index (RSI), and Bollinger Bands, to identify trends, support and resistance levels, and potential buy or sell signals.
- For instance, a trader might purchase Bitcoin when the RSI indicates it’s oversold, suggesting a potential price rebound. Conversely, they might sell Ethereum when it touches the upper Bollinger Band, indicating it might be overbought.
- By recognizing these patterns, traders aim to make informed decisions and enhance their chances of profitable trades.
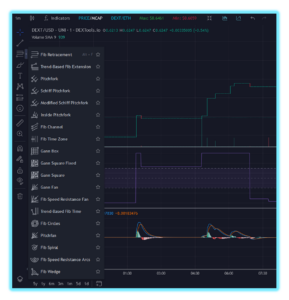
![]() To make analysis during trading more fruitful, DEXTools integrates TradingView’s advanced charting, offering more than 100 indicators and 50 drawing tools for accurate market analysis. This integration aims to elevate the trading experience with sophisticated charting and analytical capabilities.
To make analysis during trading more fruitful, DEXTools integrates TradingView’s advanced charting, offering more than 100 indicators and 50 drawing tools for accurate market analysis. This integration aims to elevate the trading experience with sophisticated charting and analytical capabilities.

Free chart tools in DEXTools
Technical Analysis Tools on DEXTools
Here are some of the key features offered by DEXTools and how they can help you in your technical analysis:
- Advanced Charts: DEXTools provides advanced and customizable charts, allowing you to analyze the price and volume history of any cryptocurrency pair.
- You can adjust the time frame down to second, choose between different chart types like candlestick or line charts, and apply various technical indicators.
- Technical Indicators: are mathematical formulas applied to price and volume data.
- On DEXTools, you have access to a wide range of indicators, such as RSI, MACD (Moving Average Convergence Divergence), and Bollinger Bands. These indicators are essential for identifying overbought or oversold conditions, trends, and market volatility.
- Price Alerts: One of the most useful features of DEXTools is the ability to set price alerts.
- For this purpose, we recommend the DEXTools Price Bot. Here is an easy step-by-step usage guide.

- Alerts notify you when an asset reaches certain price levels or when specific conditions based on technical indicators are met.
- This is especially useful for not missing important opportunities and reacting quickly to market movements.
- Real-Time Order Book and Transactions: Access to the order book and real-time transactions is vital for understanding market dynamics.
- DEXTools provides a detailed view of buy and sell orders, as well as the most recent transactions. This allows you to evaluate buying and selling pressure and detect potential market manipulations.

DEXTools RSI indicator.
Technical Analysis Strategies with DEXTools
 Trend Identification: Identifying trends is one of the most basic and effective applications of technical analysis.
 Using moving averages, you can discern whether an asset is in an uptrend, downtrend, or sideways trend.
- On DEXTools, you can overlay multiple moving averages to observe crossovers indicating trend changes.
 Chart Patterns: Like triangles, flags, and head and shoulders, they are very useful for predicting price movements.
- On DEXTools, you can identify these patterns and use them to anticipate trend continuations or reversals.
 Volume Analysis: Volume is a crucial indicator of the strength behind a price movement.
- On DEXTools, you can analyze volume to confirm trends and detect divergences. A volume spike often signals large price movements, offering entry or exit opportunities.
- Technical analysis is crucial for any cryptocurrency trader, and DEXTools makes it easier.
- With advanced charts, technical indicators, and customizable alerts, DEXTools helps you make informed decisions and enhance your trading strategies.
- For more info, explore here our articles and glossary. And we also encourage you to visit here our Youtube Academy, with the best tutorials to understand DEXTools features and the DeFi world.
- And remember: always Do Your Own Research (DYOR). Thank you and happy trading!


